Brazilian E-commerce Data Analysis
Project Information
- Category: Data Analytics / E-commerce / Business Intelligence
- Client/Context: Olist Store, Brazilian Marketplaces
- Project Date: Dec 2023
- Tools Used: Power BI (Power Query, DAX)
- Data Source: Brazilian E-commerce Public Dataset by Olist (2016-2018)
- Project URL: View Live Dashboard
Brazilian E-commerce Data Analysis: Optimizing Delivery & Customer Satisfaction for Olist
Summary
This Power BI project delves into the Brazilian E-commerce Public Dataset by Olist, analyzing over 100,000 orders from 2016 to 2018. The dashboard provides a multi-dimensional view of order performance, focusing heavily on delivery status, customer satisfaction, and geographical sales distribution. Key insights include the volume of on-time versus late deliveries, monthly delivery trends, customer review scores, and identification of product categories most prone to late delivery. I meticulously cleaned and transformed the dataset in Power Query to handle complex relationships across multiple tables and ensure accurate reporting. My analysis aims to empower Olist and its sellers with actionable intelligence to optimize logistics, improve delivery performance, and enhance overall customer experience in the competitive Brazilian marketplace.
1. Introduction: Understanding Brazilian E-commerce Dynamics
The Brazilian e-commerce landscape, facilitated by platforms like Olist, presents unique challenges and opportunities. Understanding the intricate details of order fulfillment, from purchase to delivery and customer review, is paramount for operational efficiency and customer retention. This project leverages a rich, anonymized dataset provided by Olist, encompassing 100,000 orders from 2016 to 2018. The dataset's granular detail, including order status, payment, freight, product attributes, and customer reviews, demands robust data analysis to uncover patterns that can drive strategic improvements in delivery performance and customer satisfaction.
2. Project Objectives & Goals
My core objectives for this Power BI project were to provide comprehensive insights into Olist's Brazilian e-commerce operations:
Overall Objectives:
- To analyze delivery performance across various dimensions to identify bottlenecks and areas for optimization.
- To assess customer satisfaction based on delivery status and review scores.
- To provide actionable insights for Olist and its partnered sellers to improve logistics and customer experience.
Project Goals & Deliverables:
- Overall Customer & Delivery Statistics: Display key metrics such as Total No. of Customers, Total No. of Sellers, On-Time Deliveries, and Late Deliveries.
- On-Time Delivery by Month Trend: Visualize the monthly trend of on-time deliveries to identify seasonal patterns or performance shifts.
- Total No. of Orders by Customer City: Identify geographical hotspots for orders and distribution.
- Total No. of Orders by Delivery Status: Show the overall proportion of delivered on-time versus late deliveries.
- Review Score of Customers with No Message: Analyze customer satisfaction, particularly for those who did not leave a review message.
- Late Delivery by Product Category: Pinpoint which product categories are most frequently associated with late deliveries.
- Late Delivery by Days of the Week: Determine if certain days of the week are more prone to late deliveries.
- Interactive Date Filtering: Allow users to filter data by customer order date ranges.
- Interactive Delivery Status Filtering: Enable filtering based on delivery status (On Time, Late Delivery).
3. Data Scope & Metrics
The analysis leveraged the Brazilian E-commerce Public Dataset by Olist, spanning orders from 2016 to 2018.
Data Source:
- Brazilian E-commerce Public Dataset by Olist: This dataset includes information on 100k orders, comprising details on order status, price, payment, freight performance, customer location, product attributes, and customer reviews. It also includes a geolocation dataset relating Brazilian zip codes to lat/lng coordinates.
- Key Datasets/Tables (as described in schema):
- `orders` (order status, timestamps)
- `order_items` (product info, seller info)
- `products` (product category, name length)
- `customers` (customer ID, city, state)
- `sellers` (seller ID, city, state)
- `order_payments` (payment type, value)
- `order_reviews` (review score, review comment message)
- `geolocation` (zip code, lat/lng)
Key Data Points & Metrics Captured and Displayed:
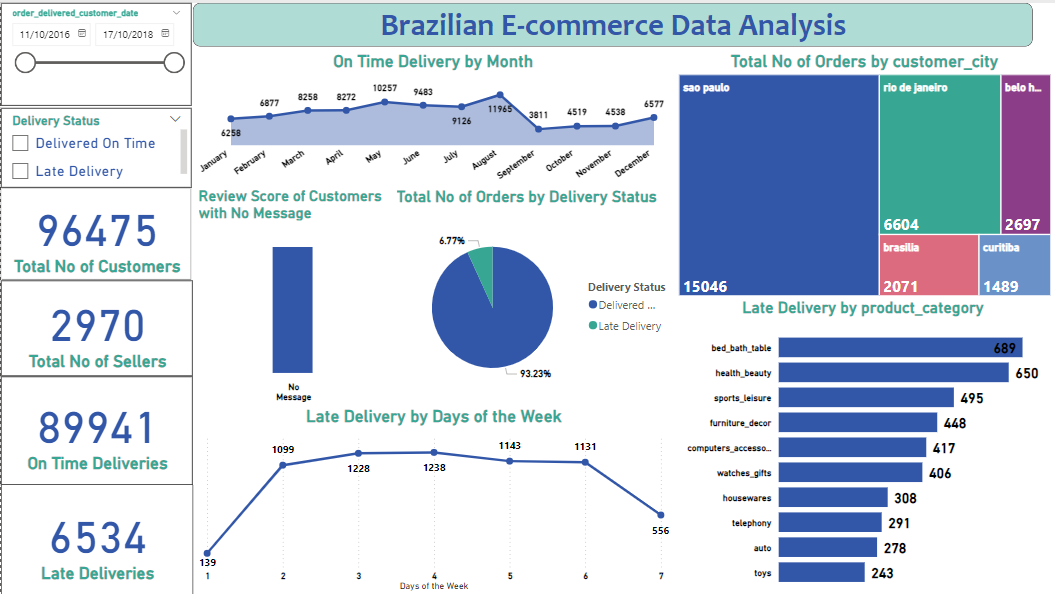
- Total No. of Customers: 96,475
- Total No. of Sellers: 2,970
- On Time Deliveries: 89,941
- Late Deliveries: 6,534
- On Time Delivery by Month: Shows monthly peaks in July (10,257) and April (9,483) and dips in January (6,258) and November (4,538).
- Total No. of Orders by Customer City: Sao Paulo (15,046), Rio de Janeiro (6,604), Belo Horizonte (2,697), Brasilia (2,071), Curitiba (1,489) are top cities.
- Total No. of Orders by Delivery Status: 93.23% Delivered On Time vs. 6.77% Late Delivery.
- Review Score of Customers with No Message: Predominantly positive (score > 3), with a smaller portion of neutral/negative.
- Late Delivery by Product Category: Top categories for late delivery include "bed_bath_table" (689), "health_beauty" (650), "sports_leisure" (495).
- Late Delivery by Days of the Week: Day 3 (Wednesday, 1238) and Day 4 (Thursday, 1143) show higher numbers of late deliveries, with Day 7 (Sunday, 556) being lowest.
Key Insights Derived from Data:
- The vast majority of Olist orders (93.23%) are delivered on time, indicating generally efficient logistics.
- Sao Paulo is by far the largest market for Olist, contributing the highest number of orders.
- Late deliveries show some monthly fluctuations, with peaks in July and April for on-time deliveries, and specific days of the week (Wednesday/Thursday) showing higher instances of late deliveries.
- Specific product categories like "bed_bath_table" and "health_beauty" are disproportionately affected by late deliveries, suggesting potential logistical challenges for these item types.
- Customers who leave no review message are generally satisfied, implying that dissatisfaction often prompts written feedback.
4. Dashboard Design & Key Insights
The "Brazilian E-commerce Data Analysis" dashboard is designed to provide a comprehensive, interactive overview of Olist's operational performance.
Dashboard Features and Key Insights:
4.1 Executive Summary & Key Performance Indicators (KPIs)
Key summary statistics are prominently displayed on the left sidebar:
- Total No. of Customers: 96,475
- Total No. of Sellers: 2,970
- On Time Deliveries: 89,941
- Late Deliveries: 6,534
These KPIs provide an immediate understanding of the scale of operations and the overall delivery success rate.
4.2 Delivery Performance Analysis
- On Time Delivery by Month (Line Chart): A line chart illustrates the monthly trend of on-time deliveries, allowing for the identification of seasonal patterns or periods needing operational review.
- Total No. of Orders by Delivery Status (Donut Chart): This chart visually represents the high percentage of on-time deliveries (93.23%) versus late deliveries (6.77%), highlighting the overall efficiency.
- Late Delivery by Product Category (Bar Chart): This horizontal bar chart pinpoints specific product categories like "bed_bath_table" and "health_beauty" that are more prone to late deliveries. This is a critical insight for targeted logistical improvements.
- Late Delivery by Days of the Week (Line Chart): This chart shows the distribution of late deliveries across the week, identifying peak days for delays (e.g., Wednesday and Thursday).
4.3 Customer and Geographical Insights
- Total No. of Orders by Customer City (Treemap): A treemap visualizes the distribution of orders by customer city, clearly showing Sao Paulo as the dominant market, followed by Rio de Janeiro and Belo Horizonte. This helps in understanding market concentration.
- Review Score of Customers with No Message (Bar Chart): This bar chart provides insights into the satisfaction level of customers who don't leave explicit feedback, helping understand general customer sentiment.
4.4 Interactive Filtering
- Order Customer Date Slicer: Allows users to filter the data by specific date ranges (e.g., 2016-2018) for time-period specific analysis.
- Delivery Status Slicer: Enables filtering by "Delivered On Time" or "Late Delivery" to deep-dive into the characteristics of each status.
The dashboard's intuitive design and interactive elements empower Olist and its partners to monitor performance, identify areas for improvement, and ultimately enhance the e-commerce experience.
5. Technical Approach & Tools
The project involved significant data cleaning and transformation given the numerous tables and potential inconsistencies in the Olist dataset, followed by robust analysis in Power BI:
- Data Acquisition & Ingestion: Multiple CSV files comprising the Brazilian E-commerce Public Dataset (orders, order_items, products, customers, sellers, order_payments, order_reviews, geolocation) were imported into Power BI Desktop.
- Data Cleaning & Transformation (Power Query in Power BI): Power Query Editor was crucial for integrating and preparing the disparate tables:
- Table Merging & Joins: Performed complex joins (e.g., `Merge Queries` in Power Query) to consolidate information from multiple tables (e.g., joining `orders` with `order_items`, `products`, `customers`, and `order_reviews`) to create a unified data model suitable for analysis.
- Date & Time Parsing: Ensured all date and timestamp columns were correctly parsed and transformed to enable time-series analysis (e.g., 'On Time Delivery by Month', 'Late Delivery by Days of the Week').
- Handling Missing Values & Inconsistencies: Addressed nulls or inconsistent entries across various columns, especially in product categories or review comments.
- Categorical Standardization: Cleaned and standardized categorical fields like 'Delivery Status' to ensure consistent reporting (e.g., categorizing into "On Time Delivery" and "Late Delivery" based on `order_delivered_customer_date` and `order_estimated_delivery_date`).
- Feature Engineering: Created new columns as needed, such as deriving the 'Day of the Week' from delivery dates for analysis.
- DAX (Data Analysis Expressions) Calculations: DAX measures were created to compute key business metrics and aggregations:
- `Total No of Customers = DISTINCTCOUNT(Customers[customer_id])`
- `Total No of Sellers = DISTINCTCOUNT(Sellers[seller_id])`
- `On Time Deliveries = CALCULATE(COUNTROWS(OrdersTable), OrdersTable[Delivery Status] = "Delivered On Time")`
- `Late Deliveries = CALCULATE(COUNTROWS(OrdersTable), OrdersTable[Delivery Status] = "Late Delivery")`
- Measures for monthly delivery counts, orders by city, and late deliveries by product category and day of the week were developed.
- Data Visualization & Dashboarding (Power BI Desktop): The dashboard was designed with a focus on clear and intuitive representation for e-commerce performance:
- KPI Cards: Utilized for high-level summaries of customer, seller, and delivery counts.
- Line Charts: For visualizing monthly and weekly delivery trends.
- Treemap: To effectively show geographical distribution of orders by city.
- Donut Chart: For a clear proportion of on-time vs. late deliveries.
- Bar Charts: Effectively compare late deliveries by product category and customer review scores.
- Slicers: Implemented for dynamic filtering by date range and delivery status.
- Publishing & Sharing (Power BI Service): The final interactive report was published to the Power BI Service, enabling stakeholders at Olist and its partners to monitor and improve their e-commerce operations.
6. Impact & Business Value
My Power BI dashboard for Brazilian E-commerce Data Analysis delivers significant value to Olist and its ecosystem:
- Improved Delivery Performance: By identifying peak times for late deliveries (e.g., specific months, days of the week) and problematic product categories, Olist can implement targeted logistical improvements and communicate effectively with sellers.
- Enhanced Customer Satisfaction: Understanding the proportion of late deliveries and the sentiment of customers (even those without explicit reviews) allows for proactive measures to address common pain points and improve the post-purchase experience.
- Optimized Resource Allocation: Insights into geographical demand (e.g., Sao Paulo being a major hub) can inform decisions on warehousing, logistics partner agreements, and marketing efforts.
- Data-Driven Decision Making: Provides Olist with a centralized, interactive tool to monitor key operational metrics, enabling continuous improvement in their marketplace efficiency.
- Competitive Advantage: By proactively addressing delivery and satisfaction issues, Olist can strengthen its position in the competitive Brazilian e-commerce market.
- Demonstration of Complex Data Integration: The successful integration and analysis of data from multiple, related tables showcase strong data modeling and transformation skills, vital for real-world business intelligence challenges.
7. Conclusion
This Power BI project successfully provides a robust and interactive analytical tool for understanding the dynamics of Brazilian e-commerce operations based on the Olist dataset. Through meticulous data cleaning, integration of multiple related tables, and insightful visualizations, key patterns related to delivery performance, customer satisfaction, and geographical distribution of orders have been revealed. The dashboard serves as an invaluable resource for Olist and its partners to monitor operational efficiency, identify areas for improvement, and ultimately enhance the overall customer experience in the competitive e-commerce landscape.